2 Week 2
3 Data visualisation

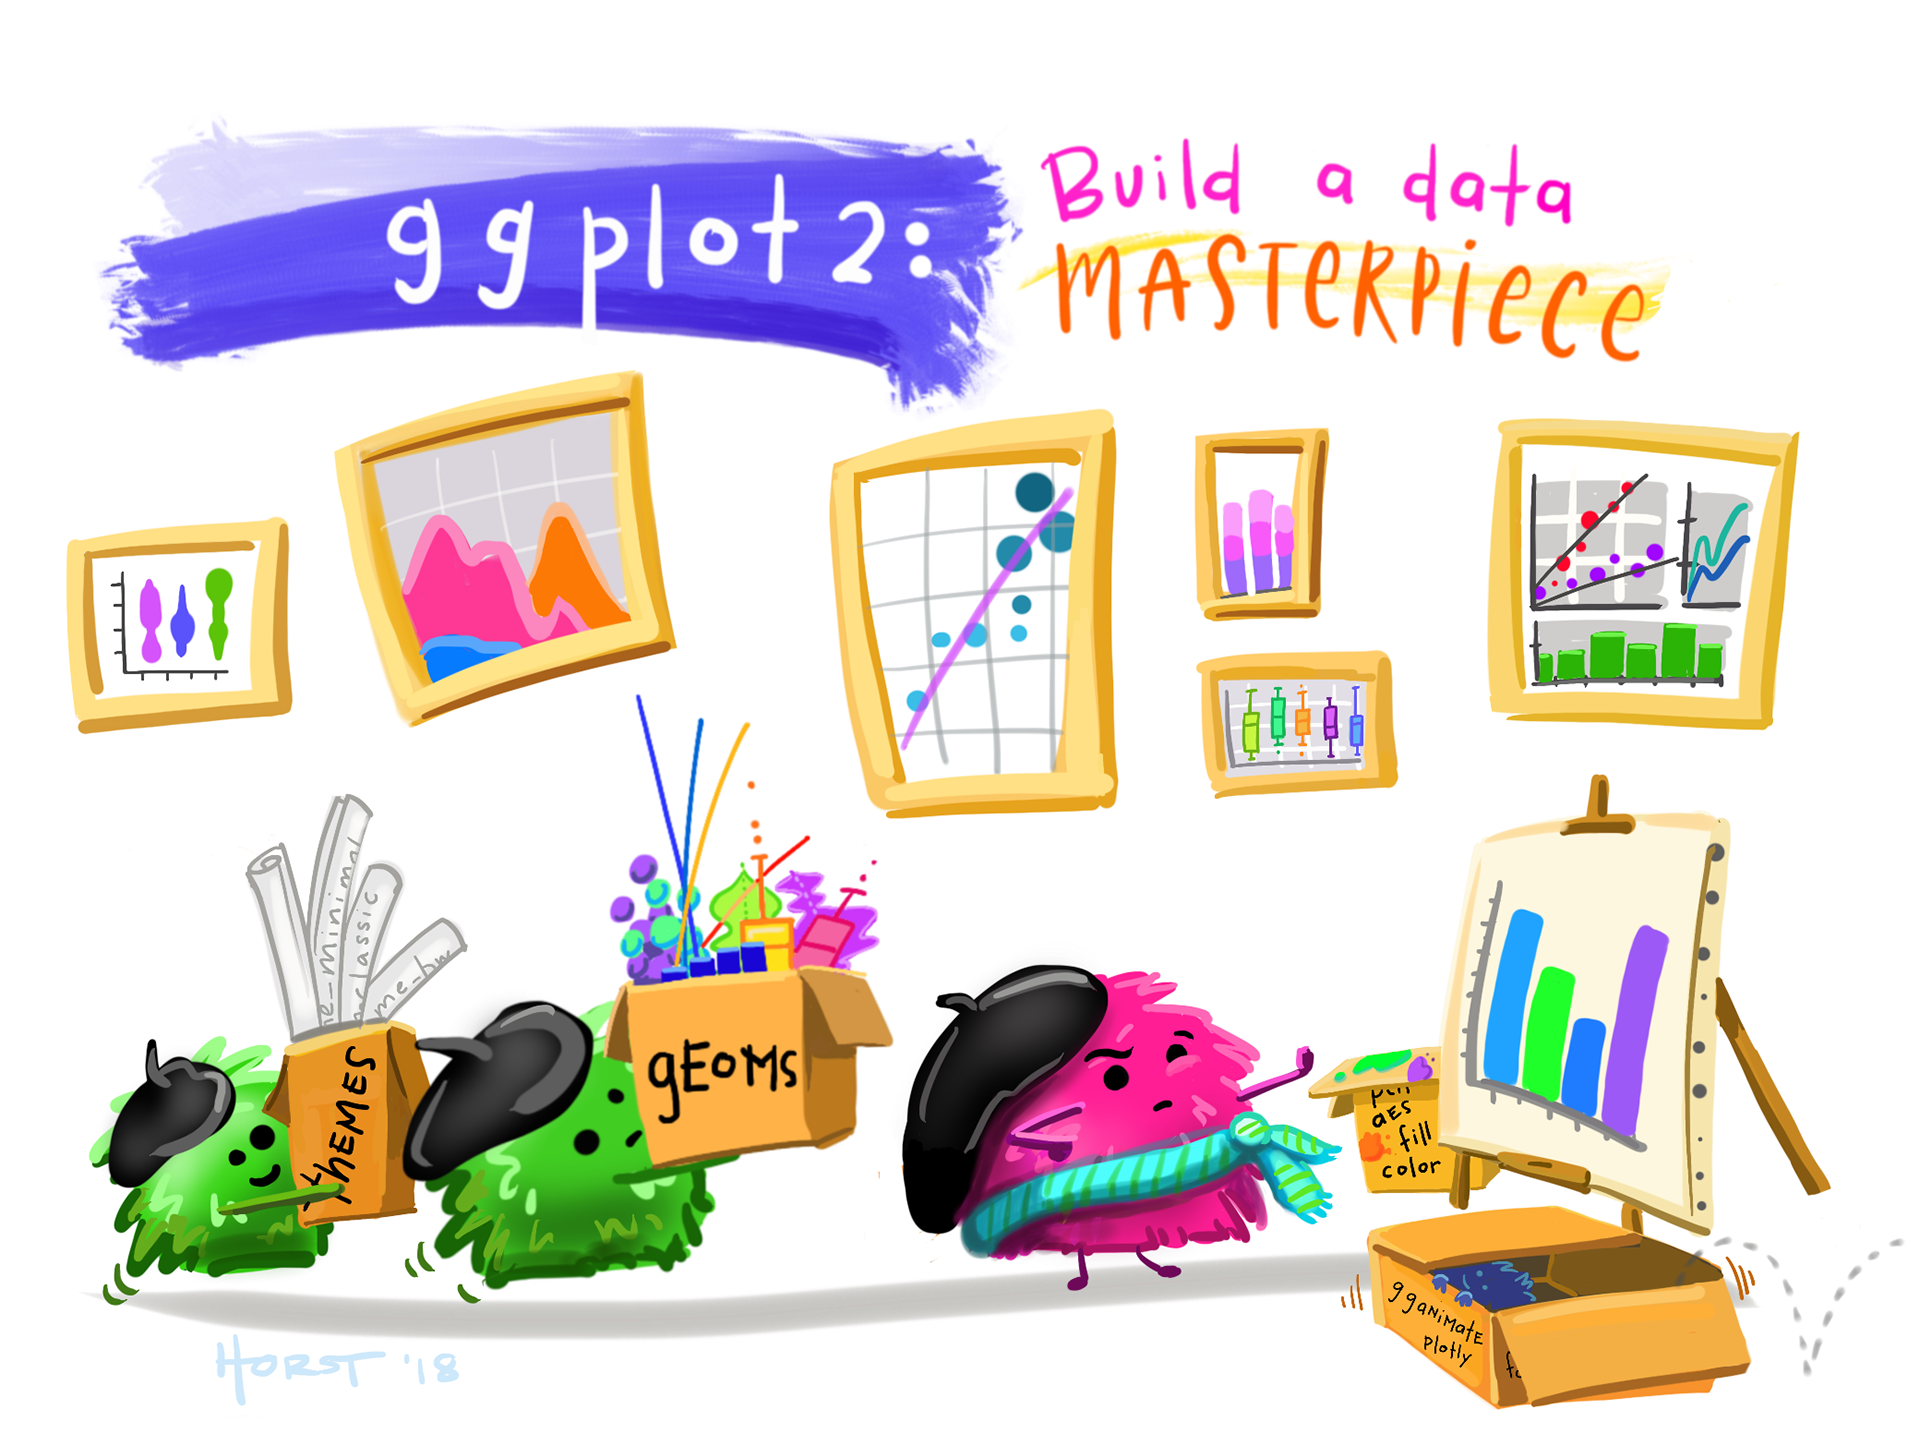
This week we are going explore one of the most powerful functions of R, that is data visualisation. The ggplot package has revolutionised how we visualise data, making it really easy to plot raw data (by participant or trial) and summarised data, in a way that is reproducible.
This week, there are a total of 8 videos to watch and each video is 10-15 min long so you can dip in and out across the week.
The idea is for you to code along with the videos, stopping and starting and troubleshooting as you go. Try the exercises Danielle recommends AND to see whether you are really getting it, have a go at the SELF TEST challenge.
For this reason, you should allocate ~ 3 hours to your coding this week.
3.1 Resources
3.2 Learning outcomes
By the end of this module you will be able to…
- Use the ggplot package to make informative plots
- Use colour to make your plots pretty (and more informative)
- Add layers to your plot
- Use jitter, boxplot, and violins to illustrate data distributions
- Use facets to plot data by group
3.3 ggplot
3.3.1 Setting up RStudio Cloud
In this video, Danielle shows you how to set up an RStudio Cloud account.
3.3.2 Make a scatterplot
In this video, covers basic mechanics of typing R commands, and takes the learner through the process of constructing a scatterplot.
3.3.3 Writing a script
In this video, Danielle recreates the exact same plot as last time, but uses a script, and explains a few weird concepts like “sourcing a script” and “printing a plot object”.
3.3.4 What are aesthetics?
In this video, Danielle explains aesthetics in the context of ggplot.
3.3.5 Aesthetics vs parameters
In this video, Danielle talks about aesthetics, the difference between aesthetics and parameters, and introduces concepts behind plot layers.
3.3.6 Global and local
In this video, Danielle shows you that even R experts suffer from technical failures! She also talks about global and local mappings in ggplot.
3.3.7 Named and unnamed argument
In this video, Danielle discusses named and unnamed arguments in R.
3.3.8 Facets and prettifying
In this video, Danielle shows you how to split plots using facets, and gives you some tips to make plots pretty.